
The students are generally satisfied; however, feedback must be better
For the second year running, Halmstad University’s graduating students this spring had the opportunity to answer a questionnaire regarding their time of study. This year, 55 percent chose to participate, an increase of 15 percentage points. The overall satisfaction was 83 percent (compared to 82 percent in 2019). The area Organisation and Management has also increased – from 58 to 61 percent; however, this is the area, together with student influence and collaboration outside the university, where students are least satisfied.
”It is very important for us to gain knowledge regarding the students’ thoughts and experiences of their education. The final-year questionnaire, together with course evaluations and annual follow-ups, is a very important instrument in developing the quality of the education.”
Pernilla Nilsson, Pro Vice-Chancellor
The questionnaire was sent to students who were registered for a programme leading to a degree at the undergraduate or graduate level, and who were registered for a course in such a programme during the spring term. A total of 627 students answered the survey, which gives a response rate of 55 percent. The year before, 40 percent chose to respond to the final-year questionnaire.
Pernilla Nilsson, Pro Vice-Chancellor and Chairperson of the Advisory Board for Quality Assurance says, “It is a large increase in percentage terms; much work undertaken in the spring certainly helped increase the response rate. At the same time we had, of course, hoped that more people would participate which enables us to develop our education programmes and student support even more, making sure students really get a student experience of the highest quality during their studies here at Halmstad University, which is of course one of the University’s major goals.”
As in previous years, the questionnaire consisted of a couple of background questions and ten question clusters; so-called index areas with statements where students had to make a decision on a four-point scale from “do not agree at all” to “completely agree”. Each index area in the questionnaire also provided the possibility for students to add their thoughts and opinions in writing.
Answers analysed jointly to level of agreement
The results from each index area give an overall “value” – total level of agreement – of how many fully or partially agree with the statements.
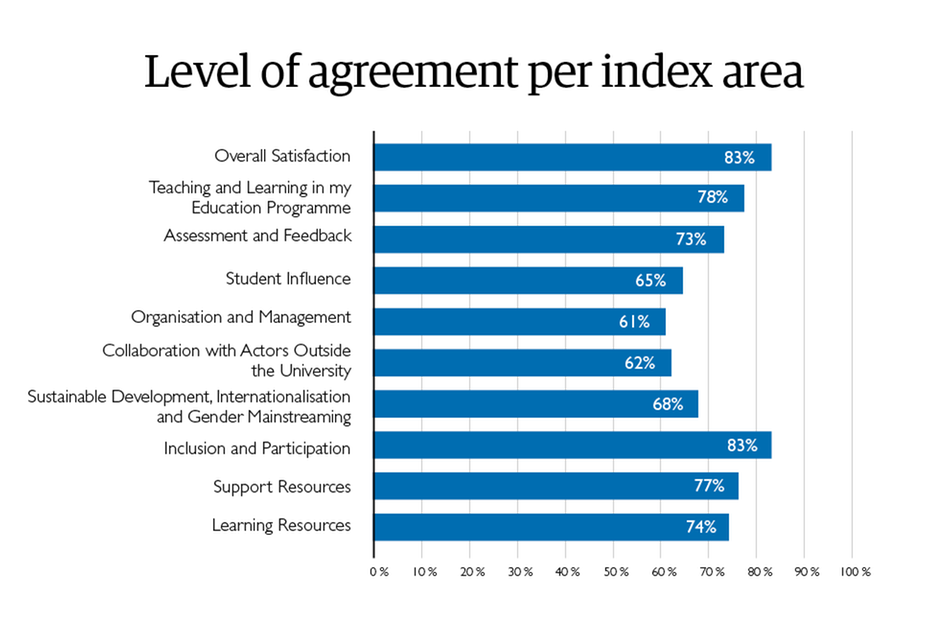
The index areas with the highest degree of agreement, General Satisfaction and Inclusion and Participation, both resulted in more than 80 percent in the level of agreement. If you divide the area General Satisfaction, the results show that 86 per cent are generally satisfied with their study time and that 80 percent are satisfied with their education. The corresponding figures for 2019 were 84 and 81 percent, respectively.
Four areas were between 70 and 80 percent: Teaching and Learning in my Education, Supporting Resources, Learning Resources and Assessment and Feedback. Four areas fall below 70 percent in the level of agreement: Sustainable Development, Internationalisation and Gender Mainstreaming; Student Influence; Collaboration with Actors Outside the University as well as Organisation and Management.
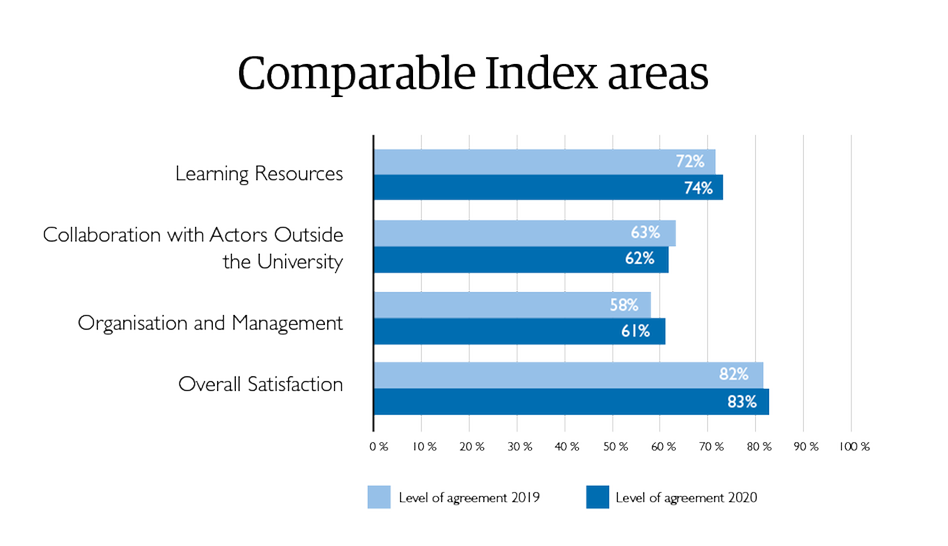
Comparison between 2019 and 2020. Since the questions were revised in certain areas in this year’s survey, it is not possible to compare all index areas. For the areas that can be compared, General Satisfaction has increased by 1 percentage point, Organisation and Management has increased by 3 percentage points, Collaboration with Actors outside the University has decreased by 1 percentage point, and Learning Resources have increased by 1 percentage point.
Written answers express frustration
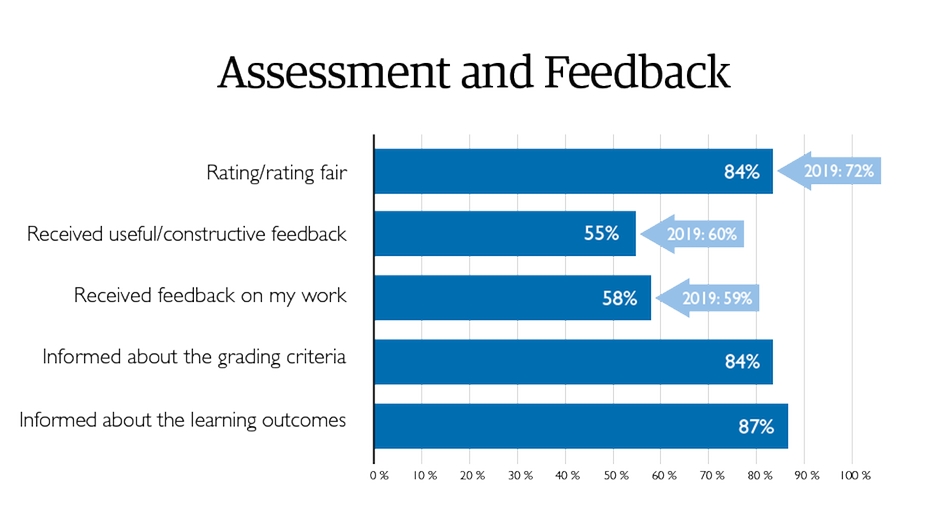
Although the area of Assessment and feedback showed 73 percent satisfaction, the survey also showed dissatisfaction with, above all, feedback – 55 percent satisfied, compared to 60 percent last year. Claims regarding information about learning objectives and grading criteria, and that assessment and grading have been fair based on performance, have a significantly higher satisfaction percentage mark. However, only some of the results can be compared between the years, as the wording in some statements was adjusted slightly in this year’s survey, which may affect comparability.
The additional written answers in the area of Assessment and Feedback highlighted that students often experience differences in how feedback is given and, also in terms of the quality and comprehensiveness of the feedback. Late date-of-return concerning the correction of examinations is also a recurring comment that is often expressed as frustration, both on the basis that the students, in turn, have to keep their own set times and dates, and what consequences it can have if they do not. However, what happens to teachers who do not follow times or who do not behave correctly towards students are questions that appear among the written answers. In certain cases, irritation is expressed over not seeing that there is any positive change after pointing out that something(s) is not being dealt with properly. Perceived problems in the assessment of different individuals’ contributions in group work are also expressed.
Pernilla Nilsson says, “This is of course serious, it should not be the case that we cannot keep set times and dates for correction of examinations. We must all take greater responsibility for giving feedback to the students in the way that is expected of us. The results from the last year’s questionnaire will be discussed in programme groups and the programme advisory team and this provides good possibilities for tackling the problem directly in the programme group.”
Statements with highest and lowest levels of agreement
The questionnaire highlights both the strengths and areas of development, and the schools have already begun work to both improve and change. The results from the final-year survey are woven into the follow-up that is done in all programmes each year. The survey also provides good input concerning, for example, the University library and aspects within both Student Affairs and student support.
“A good many of the additional written answers are very interesting and serve as a constructive basis in the analyses that programme coordinators and others do in the follow-up work,” says Pernilla Nilsson, and points out the value of the final-year questionnaire:
“It is very important for us to gain knowledge regarding the students’ thoughts and experiences of their education. The final-year questionnaire, together with course evaluations and annual follow-ups, is a very important instrument in developing the quality of the education.”
All graduating students now have opportunity to participate
So far, only those students who complete their education at the end of a spring term have had the opportunity to answer the final-year questionnaire. From now on, however, the survey will also be conducted at the end of each autumn term; therefore, students who complete their education in January 2021 will be invited to participate in the survey. In this way, all graduating students will now have the opportunity to submit comments regarding their study time and all programme coordinators have the same opportunity to use the results from the questionnaire in programme development.
Text: Lena Lundén
Translation: Nicholas Lloyd-Pugh
Ten index areas
The final-year questionnaire consists of ten index areas where students can form an opinion regarding a number of statements.
- Overall Satisfaction
- Teaching and Learning in my Education Programme
- Assessment and Feedback
- Student Influence
- Organisation and Management
- Collaboration with Actors Outside the University
- Sustainable Development, Internationalisation and Gender Mainstreaming
- Inclusion and Participation
- Support Resources
- Learning Resources
In the spring of 2020, work was done to review the questionnaire’s statements and questions, and in certain cases, they were reformulated. The British student survey: “The National Student Survey (NSS)” was a source of inspiration for the original questions in the final-year questionnaire.
Highest and lowest percentage results
The five statements that received the highest percentage results in this year’s survey are:
- The education has increased interest for the education area/field: 92 percent in agreement
- The education has been free from prejudice, inclusive and free from discrimination: 90 percent in agreement.
- The education has developed the ability to think critically: 87 percent
- Informed of the learning objectives in connection with each course start: 86 percent
- Overall satisfied with the study time: 86 percent
The five statements that received the lowest percentage results in this year’s survey are:
- Seen how the students’ feedback concerning the education has been utilised: 45 percent
- Received useful and constructive feedback of one’s work: 55 percent
- Perceived a clear connection between the education and future working life: 55 percent
- Had good opportunities to meet representatives from working life during the education: 58 percent.
- Received feedback on time concerning submitted work during the education: 58 percent
